StikstofNu · Onderzoek · Dit onderzoeksrapport is in het Engels.
Work in progress. This paper is a working draft under review. It may change, and its findings are not final.
Werk in uitvoering. Dit paper is een werkversie die nog wordt beoordeeld. Het kan nog veranderen en de bevindingen zijn niet definitief. Nederlandse versie volgt.
A two-plot sensitivity worked example: which inputs move the AERIUS 0.005 result for a small construction project
Version 0.10 (working draft), published . By StikstofNu.
SHA-256 checksum of the source paper of this edition: 5ff006663a07d0ab19f0dad67331fafea3a23f531b04b109afbd67682cb57717
Work in progress (web edition of 30 October 2026). This is a working draft under review, published here so that it can be read and checked. It may change, and its findings are not final. It is version 0.10 of StikstofNu research paper A. The English text is the only edition; a Dutch edition follows (Nederlandse versie volgt). Where the draft says it is not published, that describes it before this web edition.
What differs from the draft. References to files of the research materials are shortened to the file or folder name; those materials are not published. Nothing else is changed except what the change list of this edition names. Corrections and questions: info@alexandermooij.com.
Working draft v0.10, 26 October 2026 (Europe/Amsterdam). StikstofNu research paper A. English edition; the Dutch edition follows when this text is stable. The title was changed from an earlier one that promised more than the paper tests, to describe the paper as a two-plot sensitivity worked example (Appendix B, D10). Not published. Version 0.1 was offline. Version 0.2 added Phase 2: 2 AERIUS Connect jobs (arms E and B at both plots, with T and Ref-H as controls), run after the replica predictions were hashed, and a first coding step of the collected real files, which failed for lack of a usable collection. Versions 0.3 to 0.10 change wording, framing and disclosures only; no analysis, number or result changed.
Independence and disclosure. Independent research by StikstofNu, not affiliated with or reviewed by AERIUS, RIVM, LNV or BIJ12. AERIUS is a registered trademark in the Benelux. Nothing here replaces an official AERIUS Calculator result, which is what a municipality or province asks for. StikstofNu sells AERIUS calculations for small building projects, so a finding that a fixed input set is usually enough would favour its product. This paper therefore states what was measured, labels the rest, and makes no price, saving or accuracy claim. It was produced with an AI research agent and has not been peer reviewed. It makes no political point. Consultants and firms are not named. Plots are named by village only. Numbers use a decimal point. Evidence labels: [INF] inference, [RUN] measured on the box, [V] verified against a file, [D] decision for the project owner.
What was and was not tested
Tested. (a) That an offline replica of the AERIUS calculation chain reproduces Connect's own results for eight situations at two plots, to within 0.017 % on the maximum for the E and B arms and -0.042 % (signed) over all eight situations, which is hundredths of a percent. This is a check of build reproducibility, not of validity: the replica runs the same AERIUS code (Section 4.2a). (b) How the result at two real plots responds when inputs change: four input arms, and 36 crane-hour values placed one at a time.
Not tested.
- Consultant versus predetermined inputs. The "consultant" side here is StikstofNu's own scenarios (arms E and B, a high and a low set built from its own rule tables) and 36 crane-hour values that StikstofNu recoded itself from 38 reports, varied one parameter at a time with everything else at the product default. No real consultant input set was run through the model. The only real consultant file at the Ewijk plot (ND-13, Section 4.6) printed 0.02 mol/ha/yr, about four times the line; it includes a pile rig that the template does not cover, and its own conclusion rested on a provincial rule for temporary deposition, not on the line.
- Small projects in general. Two plots with one dwelling each.
- Any rate over real files, and any statement about how often consultants choose inputs that flip a verdict.
- Validity against nature. There is no ground truth here.
The answer first
- The paper does not test whether consultant-chosen inputs and a predetermined set give different verdicts, and gives no rate. That test needs real consultant files, each with its inputs and its result, chosen without looking at the outcome. We have none in usable form. The attempt to code the collected files failed because the collection itself failed (Section 2): 0 projects are included against a minimum of 36. Any percentage printed here would be invented, so none is printed. [V]
- At two plots, the response of the result to the inputs differs, and the one real consultant file is not comparable with the arms. At Terwolde the predetermined set gives 0.0018906 mol/ha/yr, 37.8 % of the line, and the top of the frozen input band (arm E) gives 0.0076727, 153.5 % and above the line. At Ewijk the predetermined set gives 9.3 % of the line and the top of the band 41.1 %, so the plot is below the line over the four arms. But the only real consultant file at Ewijk (a report of April 2021, AERIUS Calculator 2020, construction under one year) printed 0.02, about four times the 0.005 line, with a pile rig the template does not cover. That report first tested the construction phase against a project effect of 0.00 mol/ha/yr and found 0.02 above it. It then applied the province of Gelderland's "redeneerlijn" for small temporary deposition (at most 0.05 mol/ha/yr for two years, or an equivalent such as 0.1 for one year) and concluded that no permit was needed. So its printed value was above the line and was not decisive for that file; the factor of about 43 between it and the predetermined set mixes AERIUS version, calculation year and scope and is not explained (Section 4.6). For one report of 259 crane hours with an older crane engine, the chain (not Connect; it was not run near the line at Ewijk) estimates 110 % of the line, and the proposal flags that report as probably mistyped (Section 4.3). "Stable" at Ewijk therefore means stable over the four arms and the template-like sweeps, and no more. [RUN, V]
- Where inputs matter in this example. Multiplying every construction emission by the same factor reaches the line at a factor of 2.64 at Terwolde and 10.74 at Ewijk, while the top of the band is 4.06 and 4.42 times the predetermined set. The crane alone needs 213 hours at Terwolde and 859 hours at Ewijk to reach the line with the predetermined crane type, and 61 and 233 hours with an older, larger crane engine. Per hour of change, the engine class of the crane and the truck mixer hours move the result as much as or more than crane hours (the truck mixer reaches the line at 176 hours at Ewijk), and for those no consultant values are measured. [RUN, INF]
- The replica is reproducible against Connect, and that is all the Phase 2 jobs show. Connect's maxima for E and B differ from the replica by at most 0.017 %, and over all eight situations in the same jobs by at most -0.042 % (signed; Ewijk Ref-H). That agreement is expected because the replica runs the same code. The four verdicts match, but this is a weak test: the closest verdict to the line is Terwolde E at 153.4 % of it, the archived values for T and Ref-H and the emission ordering already imply all four, a printout-style proxy (the archived result times the ratio of nitrogen emissions) also gives all four with no model run, and the pass criterion of 0.5 % was about 29 times looser than the observed worst case. The earlier 340-situation screening pilot also contained no situation above the line. So the chain has not been tested near the line from either side, except at the Terwolde E point itself. [RUN]
- What a predetermined set does and does not do. It removes the input choice as a source of variation, and it makes the result reproducible. It does not make the verdict right. In this example the verdict at a plot well below the line changed only for the single largest crane report, and at a plot nearer the line for the top of the band. [INF]
- What would give a rate. At least 36 real projects, chosen without reading their outcome, with a registered proxy and a stated error band. A hypothesis (H-R2, Section 7) was written after the results it fits, has a premise zone in which neither plot lies (so the data could not have contradicted it), and has no evidential weight until it is tested on files not used to set it. [D]
- Context. The 0.005 line is the current calculation floor of AERIUS Calculator, not a statutory limit value, and the cabinet intends a much higher floor (Section 1). That bears directly on how much the question matters in practice.
Abstract
This paper is a two-plot sensitivity worked example: it shows which inputs move the AERIUS 0.005 mol/ha/yr result for a small construction project, and by how much, at two real plots. A predetermined input set, fixed by project type and not chosen by the consultant, would make the result reproducible. Whether it changes the verdict compared with consultant-chosen inputs is an empirical question about real files that this paper does not answer: the consultant side is represented only by StikstofNu's own input scenarios and 36 self-recoded crane-hour values, and the one real consultant file at one of the plots printed a value about four times the 0.005 line, in 2021 with AERIUS Calculator 2020; that report found its construction phase above its own 0.00 test line and then relied on a provincial rule for temporary deposition to conclude that no permit was needed (Section 4.6). Using an offline replica of the AERIUS chain, which reproduces Connect's results for eight situations to within -0.04 % (build reproducibility, not validity), we compute the result at two plots under four input arms and under 36 crane-hour values. One plot is fragile over the arms (the top of the band is above the line) and one is below the line over the arms. The result is decided by inputs within a factor of a few of the line, and, per hour of change, engine class and truck mixer hours move the result as much as or more than crane hours, with no consultant values measured for them. No rate is given: the attempt to code collected real files failed because the collection failed, and the paper registers the design for real files, the decision rules, the proxy error band and the sample sizes needed.
1 Question, definitions, scope
Question. The question that motivates this work is how often replacing the inputs a consultant chose with a fixed predetermined set changes the AERIUS verdict at the 0.005 line. This paper does not answer it. What it does is narrower: at two real plots, which inputs move the result across the 0.005 line and by how much, where the tail is in which inputs decide, and what a registered design for real files would need to answer the motivating question.
Verdict. The verdict is "above" when the unrounded maximum over receptors of NOx plus NH3 deposition for the construction situation (calculation year 2026, AERIUS 2026.0.0_20260929_655bf03b53) exceeds 0.00499999 mol/ha/yr, and "below" otherwise. The 0.00499999 value is the permit lower bound of type "arithmetic" in the AERIUS database [V]. The margin is m = c / 0.00499999. The break-even factor on all emissions is s* = 1/m. This paper makes no legal claim about the line.
Predetermined set P. The production template default (arm T of the frozen three-arm study): one crane, one excavator or shovel, a truck mixer and a small road run, sized by project type. It is barn_to_house 0.3.0 at Terwolde and new_dwelling 0.3.1 at Ewijk.
Stand-in for consultant-chosen inputs (C). No real consultant input set was run. Only one consultant-chosen input has a measured distribution: crane hours per dwelling, 36 values recoded from a 38-report benchmark compiled by StikstofNu from public documents (the recoding is StikstofNu's own and not blind). Engine stage, engine power, other machine hours and traffic have no measured consultant distribution. C is therefore represented here by three things: the frozen arms E (crane 56 h at Stage IIIB, 200 kW, all else as the product's high scenario) and B (crane 10 h, shovel 5 h); the 36 crane values placed one at a time into P; and, to check that the tools run and reproduce Connect only, 340 design points of an earlier screening pilot.
Flip. A flip is a change of verdict between P and C. Small is defined in two ways, both reported: by type (1 to 10 new dwellings) and by deposition (P below the line, with margin m). The paper reports plots, not projects.
Out of scope. Savings, price, time, accuracy against nature, and any claim about what consultants do beyond the 36 crane values.
Regulatory context [V]. AERIUS Calculator treats internal results below 0.005 mol/ha/yr as 0 and shows results at two decimals; a Tweede Kamer document (2026D14542) calls this "de rekengrens ... in feite 0,005 mol/ha/jaar". It is the current calculation floor of the tool, not a statutory limit value; whether a project needs a nature permit is a legal question this paper does not address. The minister's answer of 19 August 2026 to written questions of the member Keijzer (Aanhangsel Handelingen 2025-2026, nr. 2720, answer 3) says that since October 2025 the cabinet steers on an arithmetic floor (rekenkundige ondergrens) of 1 mol/ha/yr, under which all projects with a contribution of 0.49... mol/ha/yr or less before rounding fall; that is, just below 0.5 mol/ha/yr before rounding and 1 mol/ha/yr after rounding. The same answers say it is to be introduced as soon as possible and at the latest by the end of 2027 (answer 2) and in the fourth quarter of 2027 (answers 11 and 15). Answer 9 separates an arithmetic floor, which "ziet op de wetenschappelijke limitatie van het model", from a threshold value (drempelwaarde), which states what is considered permissible in policy; this paper uses the first meaning for the 0.005 line. The motion Boomsma c.s. (Kamerstuk 33 576, nr. 511) to introduce it at the October 2026 AERIUS update, and in any case before 1 January 2027, was rejected on 2 July 2026 (54 votes for, 96 against; Handeling 2025-2026, nr. 90, item 26). These were checked in the sources listed at the end on 26 October 2026. If the floor were raised, the 0.005 line would stop being the practical decision line, and the margins here would have to be recomputed against the new line. That bears directly on how much the question matters in practice; the paper takes no position on it.
2 What data exist
| Source | What it is | Use here |
|---|---|---|
| Archived Connect results, 21 Oct 2026 | T and the product high scenario (Ref-H) at both plots | gate, anchor points |
| Screening pilot, 21 Oct 2026 | 340 situations (180 at Terwolde, 160 at Ewijk), Connect maxima | checking the chain against Connect |
| Four Connect comparison jobs, 24 Oct 2026 | replica against Connect, including a crane-only job at Terwolde | the replica reproduced against Connect (a build check) |
| Offline replica and tools (internal change request 9 and earlier) | OPS and SRM harnesses, emission lookup | all computation |
| 36 crane-hour values | recoded from 38 benchmark reports | sweeps S1, S2 |
| Same-site case and one published case | cited case studies | context only |
| Collected real project files (KOOP route 1) | 357 notice pages and 49 PDFs; collection stopped at its size limit | coding attempted; failed for lack of a collection (see below): 0 included |
| Phase 2 Connect jobs, 25 Oct 2026 | 2 jobs, arms T, Ref-H, E, B per plot | v0.2: Connect's values for E and B, compared with the replica |
| Seven calibration projects | parser calibration set, recorded as no evidential value | not used |
The real-file sample, plainly. There is no sample of real consultant files with inputs and results that may be used for a rate. The coding step of v0.2 did not test anything, because the collection it was meant to code does not exist in usable form. It is reported as a scrape failure, not as "0 of 357 coded":
- The collection run stopped at its 5 GiB limit (5.00 GiB logged) after it followed many links to other sites. One host, the statute database wetten.overheid.nl, had 656 attempts, of which 443 succeeded (the others timed out or failed), to 197 distinct URLs that returned 47 distinct bodies, 3.93 GiB of the 5.00 GiB; 14 of the bodies are between 5.6 and 22.4 MiB. The counts are from the request log on the box (sha256 in BLOCK 17), and are given in
KOOP_ERRATA_2.md;KOOP_ERRATA_1.mdgave only the 443 and a size in MB. It never produced a frame: no coverage log, no record list. - It holds 357 notice pages. Of these, 229 are plans or policy documents by title and 128 are permit or other notices, and 125 of those have no PDF downloaded at all. Only 10 notices have any PDF, 49 PDFs in all, and 3 of those 10 notices are not plans or policy documents by title. None of the 49 PDFs contains the text string "AERIUS Calculator" (a text search; an image-only scan would not be found by it).
- The zero was foreseeable. The coding rules (
KOOP_CODING_RULES_v1.md, BLOCK 12) state what was seen before they were hashed: the length of the page-1 text and the presence of the words "AERIUS" and "Calculator" in the 49 downloaded PDFs (counts only), and a full-text count of the strings "AERIUS", "Aerius" and "mol/ha", in which 3 PDFs contain one of the strings; no number was read. With that knowledge the outcome of the inclusion step, no included project, could have been predicted. The step still followed its rules and was hashed before it ran, so it is a record, not a test. - The parser stage did not run and no outcome value was read. A rate needs a completed collection, with the harness limited to the notice files, and at least 36 included projects. One AI coder did the inclusion step, and a second human reader would be needed for any later inclusion decisions.
The seven calibration projects are not evidence. The benchmark has crane hours only, which gives sweeps but not verdicts. The two case studies are single files. [V]
What was seen before the protocol was hashed (disclosure). The Connect maxima of T and Ref-H at both plots; the pilot's maxima; the four comparison jobs; the replica gate on T and Ref-H; and the emission totals of E and B. Not seen: any E or B deposition, any chain output, any sweep output, any real-file value. In v0.2 the Phase 2 predictions were hashed before the Connect jobs were submitted (BLOCK 10; see Appendix A, item 5, for what supports the order). One result was known in advance and is not a test: E is Ref-H with the crane at 56 instead of 60 hours, so its verdict follows Ref-H at each plot.
3 Method and order of events
The protocol (PAPER_A_PROTOCOL_v1.md) was written and hashed before any analysis code (BLOCK 1). The code was hashed before it was run (BLOCKs 2 to 4). The outputs were hashed before the paper was written (BLOCK 5). The post hoc hypothesis of Section 7 was added in two addenda that are hashed and state they are post hoc (BLOCKs 6 and 7). The hash order is this project's own discipline, not an external review. Deviations are in Appendix A.
The calculation chain has three exact or near-exact parts. An emission lookup turns an input vector into emissions per source; it reproduces the Connect request for 1,962 of 1,962 sources. OPS per-kg sensitivities for the machine source class and for the truck mixer class come from the replica runs of Ref-H. A road run per situation is computed with the replica's SRM2 harness. Direct replica runs are used for E and B as a cross-check of the chain.
Steps. M0: replica against archived Connect (the gate). M1: a consistency check of the chain, V-lin (linearity per receptor) and V-chain (chain against Connect on the pilot's situations, pass if all verdicts agree and each relative error is at most 0.5 %). M2: arms E and B by direct replica runs. M3: sweeps S1 and S2 (36 crane values, with Stage IV 120 kW and with Stage IIIB 200 kW), S3 (break-even hours per crane class) and S4 (break-even factor on all emissions). M4: a proxy bridge for later real-file use. M5: sample sizes. M6 (v0.2, Phase 2): one Connect job per plot with the four situations T, Ref-H, E and B, request files written by the research writer from the arm vectors, predictions per receptor hashed beforehand, and the decision rules of PHASE2_PREREGISTRATION_v1.md (verdict equal, maximum within 0.5 %, receptor ratios within the gate, emissions equal to the lookup, controls equal to their archived values).
4 Results
4.1 The tools
The replica agrees with archived Connect on the receptor values of T and Ref-H at both plots: 100.000 % of Terwolde T receptors (56,071) and 99.998 % of Terwolde Ref-H receptors are within 1 %, and the Ewijk figures are 100.0 % and 100.0 %. [RUN] The direct replica maximum for the archived anchor points differs from Connect by 0.004 % (Terwolde Ref-H) and -0.042 % (Ewijk Ref-H), signed, replica minus Connect. Four Connect comparison jobs of 24 October agreed with the replica in 100 % of compared values at the printed digits for the crane-only job, and the same for the other three. Those jobs used the production (aarch64) build of the replica. The runs of this paper use the amd64 build, which Paper 2 reports to differ in the fourth digit at about 0.2 % of hexagons. Paper 2's amd64 runs, however, gave identical maxima and 1st and 99th percentile ratios of exactly 1, so the amd64 build cannot be given as the cause of the spread of hundredths of a percent in the Phase 2 receptor ratios below (5th to 95th percentile 0.9997 to 1.0003) and of the maximum differences of up to 0.042 %. The cause of that spread is not established here. Both results are build reproducibility: the replica runs the same AERIUS code as Connect.
V-lin. The registered criterion is the median per-receptor relative difference between the T gate output and the scaled Ref-H sensitivities, at most 0.1 %. It is 0.016 % at Terwolde and 0.012 % at Ewijk. Pass. The maximum is 0.10 % and 0.09 %.
V-chain. Over 340 situations the chain agrees with Connect on the verdict in 340. The largest relative error is 0.051 % (median 0.016 %). Pass. Limit: none of the situations is above the line. The highest Connect maximum is 0.0038131 at Terwolde (76.3 % of the line) and 0.0009538 at Ewijk (19.1 %). The verdict agreement is therefore trivial. The quantitative agreement was tested up to about three quarters of the line. Where the chain says a value is above the line, it extrapolates by linearity and that was not tested above the line. The direct replica runs of E and B (next section) are the check at that point, and they agree closely with the chain (for Terwolde E the chain minus direct difference is -0.003 %). In v0.2 Connect itself was run for E and B, including the above-line case (Section 4.2a).
4.2 The two plots
| Plot | Arm | c_max (mol/ha/yr) | % of the line | Verdict | Hexagons above |
|---|---|---|---|---|---|
| Terwolde | T (predetermined) | 0.0018906 | 37.8 | below | 0 |
| Terwolde | B | 0.0015262 | 30.5 | below | 0 |
| Terwolde | E | 0.0076727 | 153.5 | above | 8 |
| Terwolde | Ref-H | 0.0079037 | 158.1 | above | 8 |
| Ewijk | T (predetermined) | 0.0004655 | 9.3 | below | 0 |
| Ewijk | B | 0.0003624 | 7.2 | below | 0 |
| Ewijk | E | 0.0020571 | 41.1 | below | 0 |
| Ewijk | Ref-H | 0.0021366 | 42.7 | below | 0 |
All eight cells of this table are direct replica values on the Ref-H receptor set, including T and Ref-H. For T and Ref-H, the Connect values from the Phase 2 controls differ from these replica values by -0.020 % (Terwolde T), 0.004 % (Terwolde Ref-H), 0.000 % (Ewijk T) and -0.042 % (Ewijk Ref-H), signed, replica minus Connect. The E and B values were predictions made before the Phase 2 jobs; Section 4.2a gives Connect's values. [RUN]
Terwolde is fragile: T and B are below the line, E and Ref-H above, so swapping the predetermined set for the top of the band flips the verdict. Ewijk is below the line over the four arms, with the highest at 42.7 % of it. That is not the same as stable: see the sweep in Section 4.3 and the one real consultant file at this plot in Section 4.6.
Three observations, each narrow. First, B never flips from T: its crane and shovel hours are lower, and B is 0.81 (Terwolde) and 0.78 (Ewijk) times T. A low input set does not change a verdict that is already below the line. Second, E is not separable from the product's own high scenario: E is 0.971 and 0.963 times Ref-H, so agreeing with Ref-H's verdict is by construction, not evidence. The product's own class labels for the two plots ("groen-afhankelijk" at Terwolde, "groen-robuust" at Ewijk) match the E arm at both plots for the same reason. Third, the B shovel hours (production rounds 4.64 to 5) do not change any verdict: the B maximum at Terwolde is 0.0015262 with 5 h and 0.0015202 with 4.64 h. ([D2] approved by the project owner on 25 October 2026: 5 h is primary).
4.2a Connect against the replica for E and B (Phase 2): a build-reproducibility check
Connect was run once per plot on the production service (AERIUS 2026.0.0_20260929_655bf03b53), 2 jobs in all with no error and no warning, with the request files built from the same arm vectors. Each job also held T and Ref-H as controls. The replica predictions in the table of Section 4.2 were hashed before submission.
| Plot | Arm | Connect c_max | % of the line | Hexagons above | Replica / Connect - 1 (%) | Median receptor ratio |
|---|---|---|---|---|---|---|
| Terwolde | E | 0.0076714 | 153.4 | 8 | 0.017 | 1.000000 |
| Terwolde | B | 0.0015262 | 30.5 | 0 | 0.002 | 1.000000 |
| Ewijk | E | 0.0020570 | 41.1 | 0 | 0.005 | 1.000000 |
| Ewijk | B | 0.0003624 | 7.2 | 0 | 0.003 | 1.000000 |
[RUN, Connect] The four rows are the E and B subset, the arms that had no Connect value before. The largest absolute difference in this subset is 0.017 %. The same jobs also held T and Ref-H, and over all eight situations the largest difference is -0.042 % (Ewijk Ref-H, signed), so the 0.017 % figure is the subset and not the whole. The 5th to 95th percentile range of the receptor ratio for E is 0.9997 to 1.0003 at Terwolde and 0.9997 to 1.0003 at Ewijk. The emission of every source equals the lookup within the 1e-6 criterion. The Connect values for the controls T and Ref-H in these jobs match Connect's archived values of 21 October to within 0.0009 %. For these two control situations the requests of the research writer therefore reproduce the archived Connect results; this does not show that the requests are identical to the product's. All pre-registered criteria were met.
What this shows, and what it does not.
- Build reproducibility, not validity. The replica runs the same OPS and SRM code, with the same database, as AERIUS Connect, so differences of hundredths of a percent (at most 0.017 % for E and B and -0.042 %, signed, over all eight situations) show that the build and the inputs are reproduced. It cannot show that the model is right, and it is not an independent check.
- The verdict test is weak. The closest verdict to the line is Terwolde E, 53 % of the line above it; every other verdict is further away, so every verdict is more than half of the line away from it. The archived T and Ref-H values plus the ordering of the emissions already imply all four verdicts, and the printout-style proxy of Section 4.5 (the archived result times the ratio of nitrogen emissions) also gives all four with no model run. A predicted verdict that agrees under these conditions says little.
- The pass criterion was loose. The criterion for the maximum was 0.5 %, about 29 times the observed worst case of the subset.
- Where the chain is least tested. No Morris situation is above the line, and in Phase 2 only Terwolde E and Ref-H are above it. The chain's behaviour in the band within a few tens of percent of the line, from either side, was not probed by any job.
- Not covered. Arms or plots not run; source types the lookup refuses (a pile rig, urban roads); the B arm with a shovel of 4.64 hours (Connect needs whole hours, and production rounds to 5, [D2] approved).
4.3 The 36 consultant crane values
The 36 values run from 4.7 to 259 hours with a median of 23.9. The predetermined crane is 25 hours at Terwolde and 22 hours at Ewijk, close to the median. Of the 36 values, 8 are at or above 56 hours (the 80th percentile is 56), and 3 are above 100 hours.
Each value was placed one at a time into P and the chain evaluated (all else at P), at each plot, with two crane types:
| Plot | Crane type | Values that flip (of 36) | Highest result, % of the line |
|---|---|---|---|
| Terwolde | Stage IV, 120 kW (as T) | 1 | 115 |
| Terwolde | Stage IIIB, 200 kW (as E) | 7 | 329 |
| Ewijk | Stage IV, 120 kW (as T) | 0 | 35 |
| Ewijk | Stage IIIB, 200 kW (as E) | 1 | 110 |
[RUN, chain values reproduced by the V-lin and V-chain checks, which are consistency checks and not a validation of the model] With the predetermined crane type, only the single largest value (259 hours, one report) flips the verdict at Terwolde, and none flips it at Ewijk. With the larger, older crane engine the count rises to 7 of 36 at Terwolde and stays at 1 at Ewijk. These are statements about two plots: a crane value from a real project is applied to a one-dwelling plot. They are not statements about how often real projects flip, because the real projects have their own sizes, sites and other inputs. The 259-hour value is a single report; it is kept in the sweep and its effect is visible in the table. The proposal flags that report: its entry has 470 hours for a mobile crane with 501 litres of fuel (about 1.1 litres per hour), next to a separate crane entry and no excavator for the demolition, so the 470 hours most likely belong to an excavator or are mistyped. The chain values of the Stage IIIB rows above the line (at Ewijk the 259-hour row, 110 % of the line) are chain extrapolations, not Connect results. [INF]
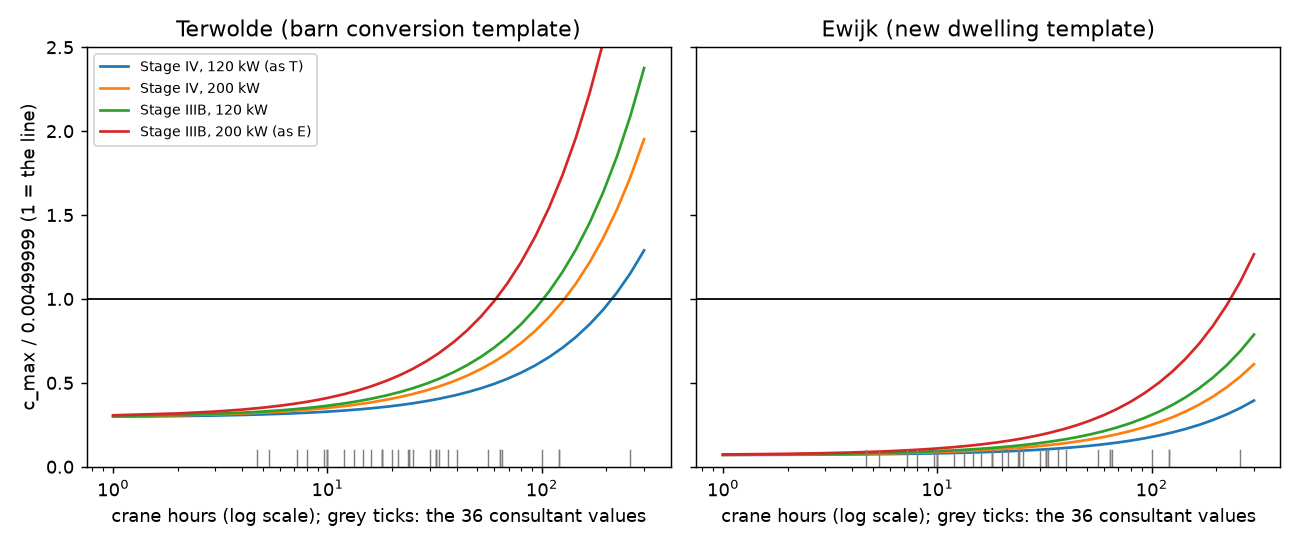
Figure 1. Break-even crane hours at each plot for four crane classes (the hours at which the result reaches the line, all else at P), with the 36 consultant values as ticks.
4.4 Break-evens and the tail
| Plot | s* (factor on all emissions) | E / T | Ref-H / T | Break-even hours: crane IV 120 kW | crane IIIB 200 kW | truck mixer | excavator or shovel | Traffic factor |
|---|---|---|---|---|---|---|---|---|
| Terwolde | 2.64 | 4.06 | 4.18 | 213 | 61 | 50 | 200 | 22 |
| Ewijk | 10.74 | 4.42 | 4.59 | 859 | 233 | 176 | 849 | 135 |
The break-even for each input is the value of that input alone at which c reaches the line, all else at P. The traffic factor is the multiple of the template's construction traffic that would be needed. [RUN]
What follows, with the label [INF] where it goes beyond the table:
- The decisive quantity is the distance of P from the line, relative to how far the free inputs can move the result. At Terwolde, 2.64 is smaller than the band's own width (4.06), so the band crosses the line. At Ewijk the line is 10.74 times away and the band is 4.42 wide, so it does not.
- The truck mixer is a high-leverage input at Terwolde. The template's truck mixer hours are well below the break-even of 50 hours, but no consultant distribution for truck mixer hours exists.
- Traffic is not a plausible flipper at either plot (the template's traffic would have to be 22 and 135 times higher).
- Hours of the crane and shovel matter, but only up to the engine class: the same crane at Stage IIIB 200 kW needs less than half the hours of the Stage IV 120 kW crane to reach the line at both plots.
Where the tail is. At both plots the top of the band (E) is 4.1 to 4.4 times the predetermined set, so the band can reach the line only where the predetermined result is above about a quarter of the line. [INF] Terwolde is above that level and fragile over the arms. Ewijk is below it and below the line over the arms. The band is not the whole tail, though: the sweep with the largest crane report (259 hours, Stage IIIB 200 kW) reaches 8.7 times the predetermined result at Terwolde and 11.8 times at Ewijk, and at Ewijk the chain puts that report at 110 % of the line (a chain estimate, not run in Connect; the report is the one the proposal flags as probably mistyped, Section 4.3). A single report like that makes the tail longer than the band. This is read off two plots and is the basis of the post hoc hypothesis H-R2 of Section 7; it is not a tested rule. For projects whose source mix is not template-like (a pile rig, many dwellings, heavy traffic) the ratio is not known. At the other end, the one published file far above the line (Section 4.6) shows input choices moving the result by a large factor without a change of verdict, which is consistent with the same logic (one file, read after the fact). [INF]
4.5 The proxy bridge (for later real-file use)
Real consultant files print a result and their inputs, not an AERIUS rerun. A proxy is needed to say what P would have given: c_swap = c_ref times the ratio of nitrogen emissions (NOx times 14/46 plus NH3 times 14/17). We tested it on all ordered pairs of the four arms at each plot (24 pairs). The ratio of the true swapped result to the proxy ranges from 0.77 to 1.30 (median 1.00), from 0.85 to 1.17 at Terwolde and from 0.77 to 1.30 at Ewijk. On NOx mass alone the range widens to 0.71 to 1.41. Any real-file use of this proxy must carry this error band. It was measured on two plots with template-like source mixes, and it is not a general property. [RUN]
4.6 Case studies already in the repository (cited, not recomputed)
Two files are cited without new computation: ND-13, read here from its original text, and BH-N07, taken from the research proposal (v9).
- The one real consultant file at the Ewijk plot (ND-13). A consultant's report dated 22 April 2021 for the same plot (the proposal identifies the plot; the text here is read from the original, benchmark file ND-13, which is box-only because it names a street address, with its sha256 registered in BLOCK 16) gives a construction phase of under one year, to be carried out in 2021, calculated with AERIUS Calculator 2020 (version 2020_20210209). It entered 91 hours for a crane (64 loaded and 27 stationary, the proposal's reading of the report; the 36 crane values of Section 4.3 are coded on loaded hours), 91 hours for an excavator and 34 hours for a Stage III pile rig, and the highest contribution printed on Rijntakken is 0.02 mol/ha/yr. A printed 0.02 is rounded to two decimals, so it lies between 0.015 and 0.025: three to five times the line used here.
- What the report did with it. It tested first against a project effect of 0.00 mol/ha/yr, which is, as far as this paper can tell, the printed form of the same calculation floor, since the tool shows two decimals. The report's own use-phase printout says "Uw berekening heeft geen depositieresultaten opgeleverd boven 0,00 mol/ha/jr" (no deposition result above 0.00 mol/ha/yr; file line 653), which is the tool's wording for a result under the floor. It found the construction effect above that. It then applied the province of Gelderland's "redeneerlijn" for projects with a small temporary deposition: at most 0.05 mol/ha/yr for at most two years, or an equivalent, with 0.02 for five years and 0.1 for one year as examples, citing a BIJ12 answer in its frequently asked questions (retrieved 9 September 2020). Because the construction lasts under one year and the effect is below 0.10, it concluded that significant effects were excluded and that no permit was needed under the nature law of the time. The same rule of thumb is in the BIJ12 Handreiking Voortoets Stikstof of February 2021 (p. 12 of the PDF).
- What follows, and what does not. The printed value was above the line, and the report's own conclusion did not rest on the line. This paper compares printed numbers only: the predetermined set at the same plot gives 0.000465, which is 9.3 % of the line, a factor of about 43 lower (32 to 54 given the rounding; the proposal gives 31 to 52 against its own value of 0.00048 for the same plot, and 0.0004655 is used here). It is not a verdict on that report, and it does not show that the predetermined set is wrong, since the two differ in AERIUS version, calculation year and scope (the pile rig is not covered by the template, and the emission lookup refuses it, Limit 9). The decision rule the report applied changes what it concluded, not the number it printed, so it is not a cause of the factor. The proposal (v9, Section B.10) splits the factor into the emission difference when the inputs are re-entered (1,83, here 1.8), an unexplained remainder that holds the AERIUS version, the calculation year, source characteristics and location (3,36, here 3.4), the pile rig (1,88, here 1.88) and the remaining differences between the two scopes, hours, power, extra machines and traffic (3,71, here 3.7). The proposal labels the last part "hours and machines for the same machine types"; the step also contains construction traffic and the template's extra machines, so it is not only hours. This is the single piece of evidence in the paper from a real consultant file. It shows one printed value above the line at a plot where the predetermined set is far below it; it is one file, and it cannot be placed on the "below the line over the four arms" label at Ewijk in either direction.
- A re-encoding of the same file (not used as support). The proposal re-entered the consultant's inputs in AERIUS 2026 with standard categories and obtained 0.0032525 with the pile rig (65.1 % of the line) and 0.0017257 without it (34.5 %). Both are below the line. A re-encoding is not a run with the consultant's inputs, since AERIUS 2026 computed the emissions of the machines, and it is not used in this paper as support for any label.
- A published file for five dwellings near forest (BH-N07). Its printed result is far above the line, and one questionable machine entry moves it by a factor of about three, still far above. Input choices move results by large factors there, and the verdict does not change. [V] proposal v9, appendix B; this paper does not recompute it. It is one file.
5 What a predetermined set does and does not do
Does. It makes the input side reproducible: two people given the same project get the same input vector and, with the same AERIUS build, the same result. It removes the input choice as a source of variation between files. In this measurement that variation is a factor of 4.1 to 4.4 between the template default T and the frozen high set E (Ref-H over T is 4.18 and 4.59), and up to 11.8 in the crane sweep. These are factors between inputs built by StikstofNu, not between a consultant's inputs and the predetermined set.
Does not. It does not show the verdict is correct. At Terwolde the predetermined set says below and the top of the band says above, and nothing in this paper says which of the two a real project's true inputs would give. It does not cover project types the template does not describe. It does not replace the official AERIUS Calculator print.
Fragility is the thing to report. For a plot where the band crosses the line, a predetermined set gives a precise answer to a question whose answer depends on inputs. Reporting that the plot is fragile, with the break-even inputs, is the honest output there. [INF]
6 Limits
- Two plots, no rate. Both plots are in one region and have their nearest habitat in the same Natura 2000 area. Two plots allow only 0, 1 or 2 fragile plots. With 1 of 2, the 95 % Wilson interval for the fragile share is 9.5 % to 90.5 %, and the Clopper-Pearson interval is 1.3 % to 98.7 %.
- Only crane hours has a measured consultant distribution. Engine stage, power, other hours and traffic are assumptions in the arms.
- E is not independent of the product's high scenario. Its verdict follows Ref-H by construction.
- Verdict agreement of the chain is weak evidence. No pilot situation is above the line, the quantitative error was tested up to 76 % of it, and in Phase 2 only Terwolde E and Ref-H are above it (Section 4.2a).
- OPS road far field beyond 5 km is omitted from the chain, and the direct runs include it. The direct runs include it and agree closely with the chain at all arms (Section 4.1), so it did not matter for these plots; it may for others.
- The receptor set is the Ref-H set. A receptor that appears only under another arm would be missed. The direct runs on the Ref-H set agree with the chain.
- The 36 crane values are StikstofNu's non-blind recoding of 38 reports from public documents, the "v4 recoded, primary" set of the proposal (v9). That set includes the value of the one consultant file at Ewijk (ND-13, 64 hours), which the proposal says must be left out of any benchmark used for Ewijk (n = 35), and it has been superseded by a v5 recoding with three entries set to missing (n = 33). The crane default of the Ewijk template T (22 hours) was itself drawn from a benchmark that includes ND-13 (proposal v9), so the Ewijk side is partly circular with the one real file. The Ewijk sweep was not rerun on the 35 or 33 values, because by the proposal's own value lists the result at Ewijk does not depend on the change: the only value that flips Ewijk is 259 hours, which remains in the v5 set, while the 64 hours of ND-13 is below the Ewijk break-even of 233 hours for the Stage IIIB crane. At Terwolde the Stage IIIB count of 7 of 36 would be 6 on the 35-value set and, by hand from the proposal's list of values above the 75th percentile, 6 on the v5 set; this was not rerun.
- Replica on amd64, while production runs OPS on ARM. Paper 2 reports differences in the fourth digit at about 0.2 % of hexagons for amd64 but identical maxima and percentile ratios; the Phase 2 spread of hundredths of a percent is larger than that and its cause is not established. The gate passed. The replica is not the official result and runs the same code as it, so agreement with Connect is build reproducibility, not validity. It was compared with Connect for T, Ref-H, E and B at two plots and for the earlier comparison jobs, and nothing else.
- Phase 2 is two jobs. Two plots, four situations each, one maximum per situation. It supports the replica for these inputs, not for other source types (a pile rig, many dwellings, urban roads), which the emission lookup refuses.
- No ground truth. Nothing here compares the model with measured deposition.
- The consultant side is a stand-in. No real consultant input set was run through the model, and the one real consultant file at Ewijk printed a value about four times the line, with a pile rig the template does not cover, and its own conclusion rested on a provincial rule for temporary deposition (Section 4.6).
7 What data would be needed, and the registered real-file stage
Data. At least 36 real small projects, each with its printed construction-phase result, machine types, power, hours, dwelling count and the plot's margin, included by a rule fixed before any outcome value is read. The collected real project files are the natural source once the collection is complete. The collection run failed (Section 2), and completing it, with a harness that does not follow links to other sites, is a decision for the project owner (D7). The extraction protocol also still needs to be agreed by the people it requires.
Stage R (registered; stages 1 and 2 run in v0.2, no project included, stage 4 not run). For each included project, swap to P by the template for its dwelling count, replace c by the proxy of Section 4.5, and classify it as stable (the proxy interval lies wholly on one side of the line and equals the printed verdict), flip, or indeterminate. Indeterminate files are those that need a full recalculation, and are listed. Counts are reported per stratum of m. The first coding step is described in Section 2: 0 projects are included, so the swap and the proxy were not applied to any real file. A rate is reported only with at least 36 included projects, and with the one-sided 97.5 % Clopper-Pearson bound. With zero flips, 36 files give an upper bound of about 10 % and 17 files give about 20 % (one-sided 97.5 %: 36 files for 10 % and 17 for 20 %). With a true flip rate of 20 %, the expected interval at 36 files is 8.2 % to 36.0 %, at 100 files 12.7 % to 29.2 %. These are computed, not assumed.
H-R2 (post hoc, addenda 1 and 2), with its history stated plainly. H-R2 says: for a template-like project with one dwelling whose predetermined result is below the line divided by 12 (0.000416666 mol/ha/yr), replacing the template's crane hours by any of the 36 consultant values, in either of the two crane classes swept (Stage IV 120 kW and Stage IIIB 200 kW), with every other input at the template default, does not flip the verdict. The range of the swept hours is 4.7 to 259 hours. Nothing else was varied one at a time: excavator and other machine hours, the engine class of other machines, truck hours and traffic, the number of dwellings, and any plot other than the two are outside the range of H-R2, and a statement about "any input swap" is not made. Four things limit it.
- It was written after the results it fits, and its premise zone is empty. It was written after all the sweeps were known. The divisor 12 is the next whole number above the largest ratio of a crane sweep result to the predetermined result, which differs by plot: 8.70 at Terwolde and 11.85 at Ewijk (both driven by the one 259-hour report, in the Stage IIIB 200 kW class), and 12 is above the larger. The zone of the hypothesis is a predetermined result below 8.33 % of the line (100 divided by 12). Neither plot is in it: the predetermined results are 37.8 % of the line at Terwolde and 9.3 % at Ewijk. So no plot tests the hypothesis, and to call the data consistent with it "by construction" is vacuous: nothing in the data could have contradicted it.
- Its predecessor was already contradicted. The first version, H-R1 (addendum 1), used 4.5, taken from the arm ratios alone. The sweep results already in hand at that time (ratios of 8.70 and 11.85) contradicted it. Addendum 2 replaced it by H-R2 only after that was noticed. "Withdrawn before any test" is true but incomplete: it was withdrawn because data already in hand contradicted it, and its replacement was set from those same data.
- Its scope is crane hours. "No input swap flips" has no defined input range. The only input measured against consultant values is crane hours, so what was swept is the 36 crane values, one at a time, with the other inputs at the template default. Engine class and other hours were not swept against any consultant distribution.
- It has no evidential weight until it is tested on files that were not used to set it. It is falsified by one confirmed flip in the zone and supported only by at least 36 files in the zone with no flip. A plot is out of reach of every one of the 36 crane values, at these two plots and these two crane classes, when its margin m is below 11.5 % (Terwolde sweep) or 8.4 % (Ewijk sweep) of the line. Ewijk, at 9.3 %, is just above its own threshold, which is why one value flips it. Whether H-R2 stays registered is for the project owner to decide (D11).
8 Reproducibility
Code is in paper_a/ and the tools of three_arm/ and p2/. Results are in results/, hashed in PROTOCOL_HASHES_paper_a_v1.txt (BLOCKs 1 to 14; BLOCKs 15 to 17 are errata and hashes of box-only files). Every number in this paper that is computed is registered in numbers.json with its source file and sha256, and build_paper_v4.py (BLOCK 18; identical to build_paper_v3.py of BLOCK 14 except the title and the superseded version in the front matter) renders the paper from the source text and results/derived.json. Per-receptor files, the replica environment and the Connect result archives are on the box and not in the repository, and are not published. The data package of decision D3 is staged on the research machine (not in the repository): a zip of the committed results, inputs, derived figures, protocols, hash file and code, with a manifest, and without any per-receptor file, request file, coordinate or job key. The sha256 of its files are in DATA_PACKAGE_SHA256SUMS.txt in the repository. Two limits of the package: the listed hash of paper_A_src.md is stale (the list was written before one sentence of the Phase 2 paragraph was reworded), and the package cannot regenerate derived.json, because the scripts also read the tool outputs, Morris summaries and gate reports that sit in the repository and on the box and not in the package. The repository at the head of the PR regenerates every derived figure; the package is a snapshot of results, inputs and code. The package was staged for an earlier text version and has not been restaged since; restaging is a decision for the project owner. The Phase 2 per-receptor predictions, request files and result zips stay on the research machine; their sha256 are in BLOCKs 10 and 11. The arms.json result had road-line coordinates removed after the run by redact.py, without changing derived.json. No Connect job was submitted for v0.1. Two were submitted for v0.2 (Phase 2); no API key or job key is in any file. The statement that the repository is private applies to this draft. Redacted copies of hashed files and of the cited proposal v9 (street addresses, the owner's first name, firm names and plot coordinates removed, nothing else changed, same line numbers) are listed in REDACTED_COPIES.md; the proposal copy is proposal-aerius-v9.public1.md, and every proposal line number cited here holds in both files.
Appendix A: hash order and deviations
- BLOCK 2 omitted the tool hash lines because of wrong relative paths. The block had already been committed. The tool hashes are in BLOCK 3 with a correction note. No result was affected.
- V-chain verdict agreement is trivial (no situation above the line). This was noted in BLOCK 5 and is stated in Sections 4.1 and 6.
- Coordinate redaction.
arms.jsonwas written with road-line coordinates, against the reporting rule. They were removed byredact.py(hashed in BLOCK 5), andderived.jsonhas the same sha256 before and after. - H-R1 was post hoc and mis-specified. Addendum 1 (BLOCK 6) set its bound from the arm ratios and overlooked the larger sweep ratios already computed. Addendum 2 (BLOCK 7) withdrew it and registered H-R2, still before any real-file value was read. The arithmetic script of addendum 2 was run before it was hashed.
- Phase 2 (v0.2). The pre-registration (BLOCK 9) and the hashes of the predictions and request files (BLOCK 10) were committed before the jobs, on the evidence of the block timestamps, which the research agent wrote. Box file times, which the repository cannot show and which are not independent evidence either, point the same way at second resolution: hashes of request files and predictions written at 19:03:24, the capacity check that precedes the first submission at 19:03:56, and the Terwolde result received at 19:05:48 after a latency of 103 s, so the first submission was after about 19:04:05 (hashes of these box files are in BLOCK 17). The production key was read into process memory by the route used on 21 and 24 October and never printed or written. 2 of the 3 allowed jobs were used, and there was no error. The research request writer (not the product's) built the request files; its controls match the archived Connect results.
- KOOP coding (v0.2). The extraction protocol proposal was not reviewed by an outside reader before this step, and it stays unhashed. The collection is incomplete (it stopped at its size limit), so the frame of its protocol could not be built; the inclusion step was run on what exists, under rules hashed before the run (BLOCKs 12 and 13). One AI coder; no second reader.
- Hashed file changed.
arm_vectors_inputs_only.jsonon the base branch (internal change request 9) had its road-line coordinates set to null in a normal commit. It is not in any hash block of this paper or of the three-arm file. The coordinates remain in the tool codearms.py(hashed in BLOCK 3 of the Paper A hash file; it is not listed in the three-arm hash file), which was not changed, because the tool needs them; and they remain in git history. - Erratum to the KOOP coding rules.
KOOP_CODING_RULES_v1.md(BLOCK 12) describes the collection run with a wrong count (one 13 MB page about 440 times). The file is not edited, because it is hashed.KOOP_ERRATA_1.md(BLOCK 15) gives 443 requests and "6 to 22 MB" and no other counts.KOOP_ERRATA_2.md(BLOCK 17) gives the counts from the box-only request log, whose sha256 is in BLOCK 17: 656 attempts and 443 successful requests on one host, 197 distinct URLs, 47 distinct bodies, 3.93 of 5.00 GiB, 14 bodies of 5.6 to 22.4 MiB. The counts of notices (357), notices with a PDF (10) and PDFs (49) are not affected. - Wording changes after v0.2. Versions 0.3 to 0.10 changed the title framing, disclosures and wording only. No analysis, number or result changed, and the results hashed in BLOCKs 1 to 14 are those the paper uses.
- Date of the run: all analysis was run on 25 October 2026 (Europe/Amsterdam), amd64 replica build, one JVM at a time.
Appendix B: decisions
The research agent was told in conversation that the project owner answered "Yes to all" to D1 to D6 of the first draft on 25 October 2026 (18:59, Europe/Amsterdam). The approval message itself is not in the repository, and this paper cannot show it. Three lines that cite it are in the repository, each of the form "[owner's first name], 2026-10-25 18:59 ("Yes to all", ...)": with "decision D4 of the Paper A list" in PHASE2_PREREGISTRATION_v1.md (hashed in BLOCK 9), with "D4" in phase2/LEDGER.md (hashed in BLOCK 11), and with "D6" in KOOP_CODING_RULES_v1.md (BLOCK 12). Each attests only the decision it names: D4 (the Connect jobs of Phase 2) and D6 (the coding step), not D1 to D6 as a whole, and no line gives a time zone. Of these, only BLOCK 9 (19:03:02) was hashed before the Connect jobs ran (19:03 to 19:06 by the ledger); the ledger line was hashed at BLOCK 11 (19:07:40), after the jobs. All three lines were written by the research agent from what it was told, so they record the claim and are not independent proof of it. Written reconfirmation is a decision for the project owner. Status:
- D1. Connect-derived road factors approved as lookup inputs. Applied.
- D2. B shovel hours 5 (production rounding) as primary. Applied; 4.64 stays a replica sensitivity and was not sent to Connect.
- D3. Data package both ways: hashes in the repository (the hash file) and a minimal result archive staged on the box, not in the repository, with a manifest and hashes; no per-receptor or coordinate file in it. Done (Section 8).
- D4. Phase 2: 2 of up to 3 Connect jobs run. Done.
- D5. The paper may go ahead as a two-plot worked example with no rate. Applied.
- D6. Coding of the collected real files may start. Attempted; failed for lack of a usable collection: 0 included (Section 2).
Open, new:
- D7. Complete the collection of the notice files with a harness that does not follow links to other sites (the stopped run spent most of its size limit on one host, Section 2). It needs a new run on public sites.
- D8. A second human reader for inclusion decisions, once there are some. Who, and when.
- D9. The road coordinates in
arms.py(and in git history of the base branch): leave (private repository), or move them to a box-only file and re-hash the tool. - D10. Title. The earlier title promised a comparison of consultant-chosen and predetermined inputs, which the paper does not test. The project owner approved a change on 26 October 2026 (by voice, 14:19, Europe/Amsterdam, as reported to the research agent; no written record in the repository). The title is now option (a) of the options then listed: "A two-plot sensitivity worked example: which inputs move the AERIUS 0.005 result for a small construction project".
- D11. Whether H-R2 stays registered (Section 7).
- D12. Whether to run further Connect jobs, for example the 259-hour case at Ewijk, the original ND-13 inputs, or a third plot. Not approved; none was run.
Appendix C: numbers in the text that are not derived figures
0.005 and 0.00499999 (the line and the database bound, [V] products-connect-export.md); 36 crane values and 38 benchmark reports (the recoding file and the benchmark); 7 calibration projects; 0.000416666 and 12 (addendum 2); 0.00111111 and 4.5 (addendum 1, withdrawn); "about a quarter of the line" (1/4.1 to 1/4.4, rounded); 1 to 10 dwellings; 95 % and 97.5 % (interval conventions); 5 km (the OPS road far field limit of the chain); the arm definitions (crane 56, 60 and 10 hours, shovel 5 and 4.64 hours, 120 kW and 200 kW) from the frozen three-arm tables; the 0.5 % chain criterion and the 20 % assumed flip rate of the sample-size table (both from the protocol); 14/46 and 14/17 (molar mass ratios); 340 and 36 as counts of situations and values; D1 to D12, BLOCK 1 to 17, 0.02 (the printed value of the ND-13 report, [V] read from the original text of benchmark file ND-13), 91, 91 and 34 hours (its crane, excavator and pile rig entries, same file), 22 April 2021, under one year, 0.00 and 0.10 mol/ha/yr (its own test line and its temporary-deposition bound), 9 September 2020 (the retrieval date of its BIJ12 reference), 2020_20210209 (its AERIUS version), "about 43" and "32 to 54" (0.015 and 0.025 divided by 0.0004655) and 0.05, 0.02 and 0.1 mol/ha/yr (the temporary-deposition rule the report cites, also in BIJ12 Handreiking Voortoets Stikstof, February 2021, p. 12 of the PDF), and 1.8, 3.4, 1.88, 3.7 (the proposal's own factor split, same source), 0.015 to 0.025 (the range a printed 0.02 stands for), 3 to 5 times the line (0.015 and 0.025 divided by 0.005), 53 % (Terwolde E: 153.4 % minus 100 %), 29 times (0.5 % divided by the 0.017 % of the subset), 3 notices (permit or other notices with a downloaded PDF, counted in koop_stage2_list.csv), 10 notices with PDFs, 49 PDFs, 357 notice pages, 656 attempts and 443 successful requests, 197 distinct URLs, 47 distinct bodies, 3.93 of 5.00 GiB, 14 bodies of 5.6 to 22.4 MiB (host wetten.overheid.nl, counted in the box-only request log request_log.jsonl), 8.33 % (100 divided by 12), 54 for and 96 against, nr. 511, nr. 90 item 26, 36 800 XIV nr. 87, 2026D14542, 0.49... and 1 mol/ha/yr (the floor before and after rounding, Aanhangsel nr. 2720 answer 3), the fourth quarter of 2027, 1 January 2027, October 2026, 2 July 2026, 26 June 2026 (the sources below), 3 jobs allowed and 2 used in Phase 2, 5 GiB (the collection limit), section numbers, years and dates. 64 loaded and 27 stationary hours (the crane entry of ND-13, proposal v9 Section B.10), 1,83, 3,36, 1,88 and 3,71 (the proposal's factor split, rounded in the text), 22 hours (the Ewijk template crane default), n = 35 and n = 33 (the proposal's sets without ND-13 and the v5 recoding), 7 and 6 (Terwolde Stage IIIB flips, counted by hand from the value lists), 470 hours, 501 litres and about 1.1 litres per hour (the proposal's flag on the largest value), 0.2 % of hexagons (Paper 2), 207, 4 and 2 (timeouts and errors among the 213 failed attempts), and the box file times 19:03:24, 19:03:56, 19:05:48 (and 19:04:05, which is 19:05:48 minus the latency of 103 s). All other numbers in the text are rendered from results/derived.json, results/derived_addendum.json or results/derived_phase2.json.
Sources
- Regulatory context, checked 26 October 2026: Tweede Kamer document 2026D14542 (the 0.005 calculation floor of AERIUS Calculator), https://www.tweedekamer.nl/downloads/document?id=2026D14542; Aanhangsel van de Handelingen 2025-2026, nr. 2720, answers of the minister of Landbouw, Visserij, Voedselzekerheid en Natuur, also for the minister of Volkshuisvesting en Ruimtelijke Ordening, received 19 August 2026, published 20 August 2026 (primary text read on 26 October 2026; the floor level before and after rounding is in answer 3, the date in answers 2, 11 and 15, the floor versus threshold distinction in answer 9), https://zoek.officielebekendmakingen.nl/ah-tk-20252026-2720.html; Kamerbrief of 26 June 2026 "Weer ruimte voor boer, natuur en bouw", Kamerstuk 36 800 XIV, nr. 87 (cited in that answer; not re-read here); Kamerstuk 33 576, nr. 511 (motion Boomsma c.s.); Handeling Tweede Kamer 2025-2026, nr. 90, item 26 (vote of 2 July 2026, 54 for and 96 against, motion rejected).
PAPER_A_PROTOCOL_v1.mdandPAPER_A_ADDENDUM_1.mdandPAPER_A_ADDENDUM_2.md;PROTOCOL_HASHES_paper_a_v1.txt.phase1-plan-2026-10-24.mdandthree_arm/(internal change request 9).P2-reproduction.md(the replica and its comparison with Connect).2026-10-21/(archived Connect results, pilot and the re-encoding).proposal-aerius-v9.md(case studies, benchmark description).products-connect-export.md(the permit lower bound).